How consistent was Tony Greig as a batsman?


How consistent was Tony Greig as a batsman?
Bradman? Sachin? Warne? Hadlee? Go on, find out. You'll be surprised
Measuring the consistency of Test players has always been a tough proposition. The statistical methods normally followed give us results that are seemingly fine but prove unsatisfactory in the end. Let me give a simple example.
Batsman A has scores of 50, 50, 50 and 50 in four innings. There is no doubt that he is a statistician's delight and the epitome of consistency. Batsman B has scores of 100, 0, 0, 100 in four innings. He is a thoroughly inconsistent player and no one knows which B will turn up on the day. However, it is eminently possible that his two hundreds have contributed to wins for his team. The real problem is that if we post a high statistical variance on Batsman B and brand him inconsistent, it goes against cricketing logic. In a pure cricketing sense, all scores above the mean value are always welcome and should not have a negative impact on the consistency values.
The other problem is that in almost all score distributions, the mean (runs per innings) is around 15 to 25% of the high score. The distribution is always lopsided. If a batsman plays 100 innings and scores 5000 runs, his mean is 50. He is likely to have 30 scores between 50 and 200 and 70 scores below 50. We must realise that 0 and 200 are both part of the game. However, the 200, while it may be four times the mean, should not be penalised. The variance component for the 0 is 50 and for the 200 it is 150.
I have done a lot of work using an innings or a Test as the unit of analysis. While the results have been acceptable, I have always felt that this was a riddle waiting to be solved. How does one arrive at a method to measure consistency keeping in mind the cricketing context? The thinking has to be out of the box - that much is certain. Finally, I think I have the answer.
I came across this idea when I did work on performance streaks for players. I realised that a streak of X innings/spells/Tests gave me a well-defined block of player activity to work with. After a lot of trials and evaluations, I have come up with the following methodology.
The cornerstone of this analysis is that consistency should only be measured using data of the player being considered. A batting average of 40 might be way below the par performance of, say, Herbert Sutcliffe, while the same average might be way above the par performance of Ian Botham. Hence, we will measure the consistency of each player against the overall career standards he has himself set.
It should be noted that the statistics in this piece are as of Test No. 2264, last month's magnificent Colombo Test between Sri Lanka and Zimbabwe, which swung between the two teams so many times that the participants and followers never knew where they were at any given point of time.
Muttiah Muralitharan: No. 1 on the list of Test wicket-takers, but No. 25 by consistency
© AFP

Methodology
The basic unit of measure will be blocks of ten innings or spells.
By "spell", I mean a bowler's total number of overs in an innings, not a continuous bowling stint, as understood normally. A block of ten is long enough to represent between five and eight Tests over about three to six months. This allows a player the opportunity to make up for failures, bad decisions, bad luck, unplayable balls and so on in other innings/spells within the block. The blocks traverse home/away Tests, series, opponents, and even years. Therefore, there is no inbuilt bias. Why ten, why not eight or 12? No particular reason: ten represents an easily workable unit. I have made trial runs with eight or 12 innings/spells as the basis. There are only minor variations in the results. The majority of the players stay in their respective areas.
An innings is established when the batsman faces a ball and a spell is recorded when the bowler bowls a ball.
This may seem unfair if a batsman scores 5 not out or a bowler bowls three wicketless overs. However, these things even out across ten innings/spells. The cut-offs are 3000 runs and 100 wickets respectively for batsmen and bowlers. In all, 184 batsmen and 177 bowlers qualify. The minimum number of blocks for batsmen is eight and for bowlers it is four.
Do I measure the player performance against an imaginary norm?
No, this is a method to measure a player's consistency and all comparisons have to be within the player's ambit. Performance analyses should be across players but consistency analyses should be within the career of the concerned player.
What is the base performance we work with?
We will take the career figures of the player and determine the average runs scored in ten innings or wickets taken in ten spells. For batsmen, the question of batting average does not arise. Instead, the actual runs per innings will be used.
How would above-average performances be handled?
If the mean for a batsman is 400 runs per block and he scores 700 runs in a particular block, what do I do? This is the key decision. In keeping with cricketing logic, I will not penalise the batsman but cap this performance at 100%. This is a key decision in the analysis. Do I detect a few academic purists shaking their heads? But I can also see many more cricket followers nodding.
How would below-average performances be handled?
If the mean for a bowler is 22 wickets per block and he takes 15 wickets in a particular block, what do I do? I will leave this performance at 68.2% (15/22). After all, these are the performances we are looking for to measure consistency.
How do we handle the last few innings/spells of a career?
Don Bradman played 80 innings and Richard Hadlee bowled 150 spells. No problem with these players. However, what do I do about Clarrie Grimmett, who bowled 67 spells, or Tony Greig, who played 93 innings? I tried leaving the seven and three as part blocks and adjusted the numbers accordingly. But it often backfired. Greig's last three innings were 0, 43 and 0. Players should not be penalised for ending their careers at certain points. Lean blocks would always lead to problems like this. So I decided that if the last block had five or more innings/spells, I would take it as an independent block. If the last block had four or fewer innings/spells, I would merge it with the penultimate block. In both these cases, tweaking is done to take care of the number of innings/spells in the final block.
Finally, what is the index of player consistency?
It is the average of the block performance percentage values across a career. This average is called the Consistency Index. The higher the average, the more consistent the player. Let me define player consistency here as "the ability of players to keep their sub-par performances to a minimum and close to their mean values".
Let us see how the process works using the data for a very consistent batsman and a very consistent bowler.
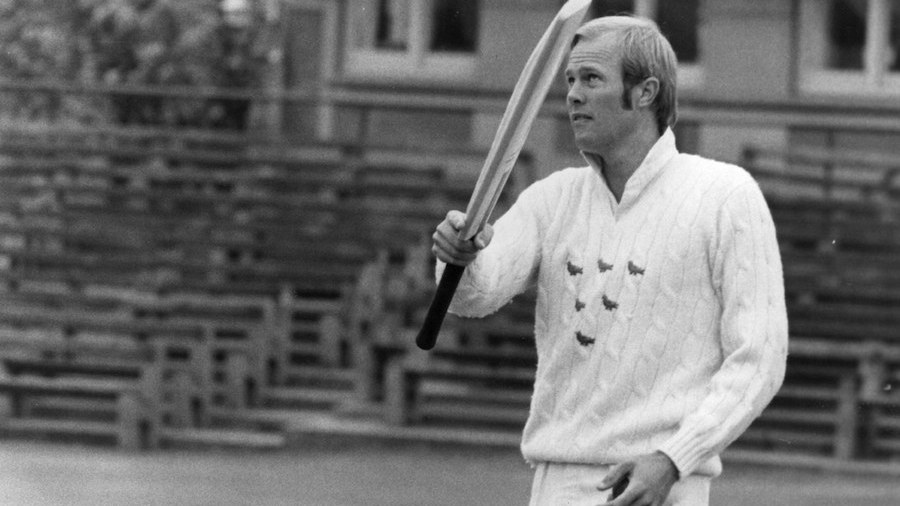
Summary of Tony Greig's career
Greig scored 3599 runs in 93 innings. His Block Mean thus works out to 387.0 runs (3599/9.3). Since the last block has three innings, the penultimate block is deemed to have 13 innings. Thus, he has nine blocks. The mean for the last block is 503, which is derived by extrapolation of the mean (387*13/10). The block analysis is explained below.
| Block | Innings | Runs | Mean | % of Mean | % - Adjusted | Consistency Index |
| 1 | 10 | 356 | 387.0 | 92.0% | 92.0% | |
| 2 | 10 | 463 | 387.0 | 119.6% | 100.0% | |
| 3 | 10 | 393 | 387.0 | 101.6% | 100.0% | |
| 4 | 10 | 486 | 387.0 | 125.6% | 100.0% | |
| 5 | 10 | 385 | 387.0 | 99.5% | 99.5% | |
| 6 | 10 | 370 | 387.0 | 95.6% | 95.6% | |
| 7 | 10 | 302 | 387.0 | 78.0% | 78.0% | |
| 8 | 10 | 440 | 387.0 | 113.7% | 100.0% | |
| 9 | 13 | 404 | 503.1 | 80.3% | 80.3% |
|
| 845.4% | 93.9% |
Greig's troughs were not low: the three 90-plus values helped a lot. Also, the remaining two values are around 80%. His final average of 93.9% indicates a very high level of consistency.
Summary of Bill O'Reilly's career
O'Reilly took 144 wickets in 48 spells. His Block Mean works out to 30.0 wickets (144/4.8). I have selected O'Reilly so that the other method of last-block handling can be explained. Since his last block has eight spells, it is left as it is, and he has a total of five blocks. The mean for the last block is 24.0, which is derived by extrapolation of the mean (30*8/10). The block analysis is explained below.
| Block | Spells | Wickets | Mean | % of Mean | % - Adjusted | Consistency Index |
| 1 | 10 | 31 | 30.0 | 103.3% | 100.0% | |
| 2 | 10 | 29 | 30.0 | 96.7% | 96.7% | |
| 3 | 10 | 25 | 30.0 | 83.3% | 83.3% | |
| 4 | 10 | 29 | 30.0 | 96.7% | 96.7% | |
| 5 | 8 | 30 | 24.0 | 125.0% | 100.0% | |
| 476.7% | 95.3% |
O'Reilly had two of his five blocks at 100% and two others at 96.7%. These led to a very high Consistency Index value of 95.3%.
Most consistent Test batsmen in history
| Batsman | Team | Runs | Innings | Blocks | Block Mean | Consistency Index |
| Tony Greig | Eng | 3599 | 93 | 9 | 387.0 | 93.9% |
| Darren Bravo | WI | 3400 | 89 | 9 | 382.0 | 93.3% |
| Herbert Sutcliffe | Eng | 4555 | 84 | 8 | 542.3 | 92.5% |
| Ian Redpath | Aus | 4737 | 120 | 12 | 394.7 | 91.8% |
| Arjuna Ranatunga | SL | 5105 | 155 | 16 | 329.4 | 91.7% |
| Roy Fredericks | WI | 4334 | 109 | 11 | 397.6 | 91.2% |
| Alan Knott | Eng | 4389 | 149 | 15 | 294.6 | 91.2% |
| Kevin Pietersen | Eng | 8181 | 181 | 18 | 452.0 | 91.1% |
| Gordon Greenidge | WI | 7558 | 185 | 19 | 408.5 | 91.0% |
| Saeed Anwar | Pak | 4052 | 91 | 9 | 445.3 | 91.0% |
| Linsay Hassett | Aus | 3073 | 69 | 7 | 445.4 | 90.9% |
| Joe Root | Eng | 4875 | 102 | 10 | 477.9 | 90.5% |
| Ijaz Ahmed | Pak | 3315 | 92 | 9 | 360.3 | 90.4% |
| Allan Border | Aus | 11174 | 265 | 27 | 421.7 | 90.2% |
| Greg Chappell | Aus | 7110 | 151 | 15 | 470.9 | 90.0% |
Greig is the most consistent Test batsman ever. The illustration above indicates how he achieved his amazing Consistency Index value of 93.5%. His Block Mean value is 387.0, and his minimum block compilation is 302. This is within around 25% of the mean, and that has helped produce such a high Consistency Index value.
Darren Bravo has an almost identical Block Mean value as Greig, and his block runs of 372, 403, 564, 310, 362, 377, 292, 349 and 371 (nine innings) has secured an almost similar Consistency Index value of 93.3%. However, Bravo's is a currently running career, and as and when he returns, the figures will change.
Herbert Sutcliffe had an average of 64 at the end of his first Test. He played 53 more and never once did it go below 60. So his position at No. 3 on this list is not a surprise. His eight blocks are 813, 535, 556, 526, 530, 665, 459 and 471 (14 innings), for a Consistency Index value of 92.5%. His Block Mean value of 542.3 is the highest in the top 15.
The elegant Australian batsman of the '60s and '70s, Ian Redpath, is next, with a Consistency Index value of 91.8%, followed closely by Arjuna Ranatunga, at 91.7%. The attacking West Indian opener Roy Fredericks is a surprise placement, bracketed with another surprise, Alan Knott. The latter had an expectedly lower Block Mean value of 294 runs but achieved this figure across 15 blocks to Fredericks' 11.
Who would have thought that the mercurial batsmanship of Kevin Pietersen would merit eighth place, at 91.1% - and across 18 blocks at that? In one block, Pietersen scored 303 runs for a 67.0% value. Otherwise, he was always above 75%. Gordon Greenidge is in ninth position, with 91.0%, achieved over 19 blocks. His penultimate block was a disaster, at 127 runs and 31.1%. But for this, he would have finished higher. Saeed Anwar completes the top ten, with a Consistency Index value of 91.0%.
We all suspected that Joe Root is a consistent batsman, and that is reinforced by him being in 12th place on this list, with 90.5%.
A graphical depiction of the most consistent batsmen looks like this.
© Anantha Narayanan

Readers can note the almost flat nature of the curves. Greig and Sutcliffe had below-average last blocks, while performing at or above their par values for the better part of their careers. Darren Bravo's career has come to a stuttering halt; however, there is a clear upward trend recently. After a few dips, Redpath's career graph is almost totally flat. In the second half of his career, he has performed at or above his par.
Least consistent Test batsmen in history
| Batsman | Team | Runs | Innings | Blocks | Block Mean | Consistency Index |
| Dennis Amiss | Eng | 3612 | 88 | 9 | 410.5 | 77.2% |
| Victor Trumper | Aus | 3163 | 89 | 9 | 355.4 | 78.2% |
| Gautam Gambhir | Ind | 4154 | 104 | 10 | 399.4 | 78.6% |
| Sanath Jayasuriya | SL | 6973 | 188 | 19 | 370.9 | 79.6% |
| Navjot Sidhu | Ind | 3202 | 78 | 8 | 410.5 | 80.0% |
Let us now have a look at the five least consistent Test batsmen ever. Dennis Amiss had a poor start to his career, scoring 151 runs in his first ten innings. He ended almost as poorly, with 175 runs in his last eight. In between, he had periods of deluge and drought. This is reflected in his Consistency Index value of 77.2%. He had block accumulations of 151, 189, 603, 472, 774, 425, 241, 582, and 175 (eight innings), as against the Block Mean of 410.
Victor Trumper had a turbulent career: 282, 235, 347, 595, 197, 200, 377, 774, and 156 (nine innings), which led to a Consistency Index value of 78.2%. Gautam Gambhir was similarly inconsistent; he followed blocks of 875 and 794 with 154.
Others among the 20 least consistent batsmen in Test history include Denis Compton, Virender Sehwag, Jimmy Adams, Dilip Vengsarkar, Marlon Samuels, Keith Fletcher, Aravinda de Silva and Herschelle Gibbs.
© Anantha Narayanan

There is no better visual depiction for inconsistent batsmen than these graphs. The crests and troughs appear with monotonous regularity, especially for Sanath Jayasuriya.
Most consistent Test bowlers in history
| Bowler | Team | Wickets | Spells | Blocks | Block Mean | Consistency Index |
| Chris Cairns | NZ | 218 | 104 | 10 | 21.0 | 96.3% |
| Geoff Arnold | Eng | 115 | 61 | 6 | 18.9 | 96.2% |
| Yasir Shah | Pak | 149 | 50 | 5 | 29.4 | 95.6% |
| Bill O'Reilly | Aus | 144 | 48 | 5 | 30.0 | 95.3% |
| John Snow | Eng | 202 | 93 | 9 | 21.7 | 94.9% |
| Ryan Harris | Aus | 113 | 52 | 5 | 21.7 | 94.7% |
| Neil Wagner | NZ | 130 | 61 | 6 | 21.3 | 93.8% |
| Neil Adcock | SA | 104 | 46 | 5 | 22.6 | 93.6% |
| Lasith Malinga | SL | 101 | 59 | 6 | 17.1 | 93.3% |
| Darren Gough | Eng | 229 | 95 | 10 | 24.1 | 93.1% |
| R Ashwin | Ind | 275 | 92 | 9 | 29.9 | 92.9% |
| Andy Caddick | Eng | 234 | 105 | 11 | 22.3 | 92.9% |
| Vanburn Holder | WI | 109 | 72 | 7 | 15.1 | 92.9% |
| Mohammad Asif | Pak | 106 | 44 | 4 | 24.1 | 92.8% |
| Mohammad Rafique | Ban | 100 | 48 | 5 | 20.8 | 92.8% |
Chris Cairns is the most consistent Test bowler ever. Over the past few years, he has appeared more in courtrooms than on cricket grounds or in broadcasting boxes. But he was a terrific allrounder, and while his bowling numbers are impressive - 218 wickets at 29.40 - it is his consistency that is astonishing.
Let us look at his block performances: 21, 19, 19, 23, 21, 24, 21, 21, 25 and 24 (14 spells). His Block Mean is 21 wickets. His three below-par values are 90.6%, 90.6% and 81.8%. That is some consistency, and has resulted in a Consistency Index value of 96.3%.
Geoff Arnold was almost as consistent as Chris Cairns and falls short by only 0.1%. His Block Mean value, however, is lower at 18.9. None of Arnold's blocks is lower than 90%.
Who would have guessed that the third bowler on this list would be Yasir Shah? Yasir moved into the top ten after his sterling performances in Bridgetown and Roseau earlier this year. His Block Mean is a high 29.8, and in his five blocks he has taken 30, 35, 25, 28 and 31 wickets. Never has he gone below 84%. It is true that having bowled only 50 spells in his career has helped, but it is remarkable how he makes up for barren Tests with resounding performances in others.
O'Reilly is in fourth place, and John Snow completes the top five. Three modern bowlers - Ryan Harris, Neil Wagner and Lasith Malinga - find spots in the top ten, with Consistency Index values exceeding 93%.
It is not a surprise that the Consistency Index values for bowlers are slightly higher than those for batsmen. The main reason is that the percentage of below-par blocks for bowlers is 51.4%, whereas for batsmen it is 53.4%. This is the order of difference. Two per cent more bowler performances are capped at 100% levels.
© Anantha Narayanan

Look at the graph for Cairns. A virtual straight line, barring a couple of blips.
Least consistent Test bowlers in history
| Bowler | Team | Wickets | Spells | Blocks | Block Mean | Consistency Index |
| Wilfred Rhodes | Eng | 127 | 90 | 9 | 14.1 | 70.5% |
| Carl Hooper | WI | 114 | 145 | 15 | 7.9 | 73.9% |
| Trevor Bailey | Eng | 132 | 95 | 10 | 13.9 | 77.4% |
| Mushtaq Ahmed | Pak | 185 | 89 | 9 | 20.8 | 77.8% |
| Monty Noble | Aus | 121 | 71 | 7 | 17.0 | 78.1% |
| Alf Valentine | WI | 139 | 63 | 6 | 22.1 | 79.7% |
Wilfred Rhodes is the least consistent bowler in the history of Test cricket. Since he took only 127 wickets in 90 spells, his Block Mean value is a low 14.7. But just look at his wildly varying block wickets: 27, 32, 17, 3, 16, 1, 8, 7 and 16. His Consistency Index is a miserable 70.5%. There are reasons for this wild variation. After his first 20 Tests, Rhodes ceased to be a front-line bowler but kept on bowling.
It is not surprising that Carl Hooper, the West Indian allrounder who was more batsman than bowler, finished with a bowling Consistency Index of 73.9%. Almost a similar situation exists with Trevor Bailey, who has a Consistency Index value of 77.4%. Mushtaq Ahmed, Monty Noble and Alf Valentine complete the bottom six, all with Consistency Index values below 80%.
There are four specialist bowlers in the bottom ten: Mushtaq, Alf Valentine, Rodney Hogg and Jerome Taylor. Valentine, who started his career with hauls of 39, 28 and 29 wickets and finished with a horror sequence of 13, 14 and 16 (13 spells), has a Consistency Index value of 79.7%. Hogg started with a bang, taking 40 wickets in his first block, and then tailed off to 18, 16, 11, 15, 16 and 7 (six spells). Taylor followed a block of nine wickets with one of 24, a block of 25 with one of seven, and a block of 22 with one of eight. This explains his inconsistency.
© Anantha Narayanan

There are nice variations even among these four inconsistent bowlers. No single obvious pattern can be observed.
Top players' standings
Most cricketers with long careers are in the middle two quartiles. Let us look at how some well-known players fare in the consistency stakes.
Don Bradman is in 52nd position, with a Consistency Index value of 88.1%. This is in the second quartile.
Sachin Tendulkar is in 100th position, with a Consistency Index value of 85.9%. This is in the lower half.
Ricky Ponting is in 146th position, with a Consistency Index value of 83.5%. This is a fairly low number and puts him in the fourth quartile.
Brian Lara is in 53rd position, with a Consistency Index value of 88.1%, just behind Bradman. This is in the second quartile.
Sunil Gavaskar is in 123rd position, with a Consistency Index value of 85.1%. He is in the third quartile.
Allan Border is in 14th position, with a Consistency Index value of 90.2%. This is very close to the top ten. Border is the best placed among the big scorers.
Muttiah Muralitharan is in 25th position, with a Consistency Index value of 92.1%. This is in the first quartile. Muralitharan is the most consistent among the top wicket-takers.
Shane Warne is in 81st position, with a Consistency Index value of 89.1%. This is in the second quartile. This is somewhat unexpected, considering that Warne performed very well around the world.
Anil Kumble is in 73rd position, with a Consistency Index value of 89.4%. He is comfortably in the second quartile.
Glenn McGrath is in 35th position, with a Consistency Index value of 91.7%. This is in the first quartile. This level of consistency was probably expected from McGrath.
Kapil Dev is in 165th position, with a Consistency Index value of 82.8%. Kapil is in the bottom 15 of the table.
Richard Hadlee is in 45th position, with a Consistency Index value of 90.8%, which places him in the top quartile.
Standard statistical measures
In order to validate the results, I also worked out the Standard Deviation (SD) and Coefficient of Variation (CoV, calculated as SD/Mean) values. To present the CoV tables in this article would take too much space and would be superfluous. However, I can affirm that there is a very good correlation between the Consistency Index and the CoV values. Just an illustration: the lowest CoV among Test batsman, 0.165, belongs to Tony Greig.
Anantha Narayanan has written for ESPNcricinfo and CastrolCricket and worked with a number of companies on their cricket performance ratings-related systems
© ESPN Sports Media Ltd.


