All teams use the DRS, but some teams (and players) use it better than others
The idea of harnessing video resources to assist umpires has been around for many years, and would often be raised whenever an umpiring blunder changed the course of a Test. In 1974 the Test umpire Bill Alley recalled a conversation with Syd Buller (who had died in 1970), where Buller had proposed assisting umpires with television replays, which had only come into regular use in the 1960s. Alley even mentioned the use of red and green lights. There were other similar suggestions over the years.
Video assistance with run-outs and stumpings was introduced in 1992, but assistance with the more contentious lbw and caught-behind decisions had to await improvements in detection technology and computing power. From time to time, controversy provoked calls to extend the reach of the decision review. In Sydney in 2008, Andrew Symonds edged to the wicketkeeper on 30 but was not given out. He went on to 162; Australia won an acrimonious Test with seven balls to spare and took the series 2-1. Pressure to correct such howlers increased.
In July 2008 a new Decision Review System was inaugurated in India's Test series in Sri Lanka. Opinions on that experiment depended on whom you talked to. Of the 12 decisions that were overturned under the DRS, only one favoured India, which set the scene for years of resistance from the Indian board. The wider cricketing world, however, was satisfied that the DRS would be a helpful innovation, and the system was officially introduced in Tests in November 2009.
No. 1: the Sehwag lbw in 2008 that became the first decision overturned under the UDRS (as the system was called then)
© AFP
")
The concept has remained fairly stable since then. In September 2013, the rules were tweaked to allow teams to reset their review counts after 80 overs. In September last year, the criteria were changed to widen the frame of contact between ball and stump in lbw out decisions. A month later, India agreed to use the system. (Zimbabwe has made little use of it, perhaps for financial reasons.)
There have been more than 2100 reviews in Tests. This article uses information in the notes attached to ESPNcrincinfo's scorecards (up to mid-March 2017), which list all instances of DRS use. Once you get used to the terminology - ESPNcricinfo uses the word "upheld" to indicate that the review has been successful, i.e. the umpire's decision has been overturned - these notes are a most useful resource. I have used these as a reference and cross-checked them against ball-by-ball texts to compile a database of the DRS in Tests. ESPNcricinfo scorecards do not name the bowlers involved, but these can be looked up.
The statistics do not capture the occasional instances of teams failing to challenge a decision when perhaps they should have. Or cases of a review being needed when none were available.
With the DRS now bedded down and in use for eight years, it is worth looking for historical changes.
| Year | Matches | % overturned | Referrals/match | Overturns/match |
| 2009 | 23 | 27 | 9.0 | 2.4 |
| 2010 | 18 | 30 | 7.4 | 2.2 |
| 2011 | 29 | 25 | 9.7 | 2.4 |
| 2012 | 23 | 28 | 9.3 | 2.7 |
| 2013 | 25 | 24 | 10.4 | 2.5 |
| 2014 | 34 | 21 | 9.2 | 1.9 |
| 2015 | 31 | 24 | 9.7 | 2.3 |
| 2016 | 32 | 32 | 12.6 | 4.0 |
Years indicate 12 months between September and August, except for 2016, where the period under consideration is September 2016 to mid-March 2017
Batsmen v bowlers:
* Of the more than 2100 reviews, 26.2% have resulted in on-field decisions being overturned.
* About 41% of reviews were by the batsman (that is, the initial decision was out) and 59% by the bowling team.
* Batsmen do better at getting decisions overturned, with 34% success. Bowling teams average about 20%. Looking at it another way, 34% of "out" decisions are overturned if reviewed. Only 20% of reviewed "not outs" get changed.
* The main reason for this difference is the reviews of wicketkeeper catches: batsmen generally know if they have hit the ball, and are likely to get a decision in their favour when they review. Lbw reviews tend to be more speculative.
All of which boils down to about 1.4 batting overturns and 1.2 bowling overturns per match. These roughly balance out. Fears that the system would bring a surge in the frequency of dismissals have not been borne out.
It's a batsman's game: reviews by bowling teams tend to have about a 20% chance of success, as against 34% for those by batsmen
Dave Rowland / © Getty Images

The 2013 change, allowing challenges to be reset after 80 overs, has had an effect. The number of challenges increased slightly, and the success rate dropped by 10 to 15%. The number of decisions overturned per match also changed slightly (about 5%).
Over 30 Tests have been played since the 2016 decision to widen the frame of contact between ball and stump in lbw "out" decisions. And it would appear that the effect has been to increase both the number of referrals per match and the number of decisions overturned.
The lbw question:
* About 74% of referrals are for lbws, and 18% for wicketkeeper catches. The rest are for catches elsewhere, notably at short leg, while a small number are indeterminate (from text descriptions).
* The overturn rate is only 22% for lbws as against 40% for wicketkeeper catches, which reflects the complexity of the lbw law. It is interesting how bowlers are both uncertain and very often wrong about lbws, even after vociferous appeals.
The meat is in the leg: nearly three quarters of all decisions referred are for lbws
Ian Kington / © AFP

A feature of lbw reviews is the umpire's call; in cases where tracking shows only a part of the ball striking the stumps, the on-field umpire's original call stands. Normally, if the various other conditions are met, you would think that a ball shown to be striking the stumps should be called out. But in such cases a margin for error in the ball tracking comes into play. Since 2012, approximately one-third of lbw reviews have come down to umpire's call (relying on ESPNcricinfo's text descriptions here, so there may be some uncertainty), which means the decision would have been upheld even if the replay showed it was incorrect. When umpire's call is not invoked, the overturn rate for lbws rises from 22% to 27%.
There is a pattern to the use of the DRS in longer innings, ones lasting more than 100 overs. Through the first 60 overs, the rate of use is fairly constant but then the incidence rises by about one-third between overs 70 and 80 (as teams begin to anticipate the reset of the count), and rises sharply again after the 80-over mark, when new reviews become available. The use of the DRS between overs 80 and 90 is near double that seen before the 70th over. After the 90th over, the rate declines again to some extent but remains elevated; by this stage, many innings are into the tail end and potential DRS incidents increase.
A popular topic among commentators and on social media is the strategy and effectiveness of various teams in using the DRS. The following table compares the overall success of teams: remember that a high percentage of overturns indicates better use of the system.
| Team | Success | Batting | Bowling |
| Zimbabwe* | 34% | 37% | 29% |
| India* | 30% | 60% | 18% |
| Australia | 29% | 36% | 24% |
| South Africa | 28% | 36% | 23% |
| England | 27% | 34% | 23% |
| Bangladesh* | 27% | 43% | 16% |
| Sri Lanka | 25% | 36% | 19% |
| New Zealand | 25% | 36% | 19% |
| Pakistan | 23% | 29% | 19% |
| West Indies | 23% | 30% | 17% |
These teams have made limited use of the DRS, so the sample size might be small and unreliable
The success rates of teams, by this measure, have been broadly consistent through the history of the DRS. When I first did this analysis in 2013, Australia were on top and West Indies were last, but the spread of results was greater. West Indies are still last but have improved their success from 21% to 23% since 2013. Australia, while still leading among the teams that have used the DRS widely, have dropped from 31% to 29%. England have fallen from 29.5% to 27%. South Africa have improved, while New Zealand have declined, both by about two percentage points.
Misbah and Younis lead the way
The batsman who has been involved in the most reviews is Misbah-ul-Haq, with 41, followed by Alastair Cook with 39 and Younis Khan with 37. Some players acquire, fairly or otherwise, a reputation for overuse of the review system. Some - often the same players - seem to attract lots of reviews. Perhaps it is more interesting to look at reviews initiated by batsmen themselves.
| Player | Batting reviews | Success |
| Misbah-ul-Haq | 18 | 28% |
| Younis Khan | 17 | 41% |
| Alastair Cook | 15 | 47% |
| Brendon McCullum | 15 | 27% |
| Steven Smith | 13 | 38% |
| Stuart Broad | 13 | 31% |
| Azhar Ali | 13 | 46% |
| Rangana Herath | 13 | 38% |
| Joe Root | 12 | 33% |
| AB de Villiers | 12 | 50% |
| Shane Watson | 12 | 33% |
Bear in mind that the average success rate for batting reviews is 34%, so anyone with a higher percentage is making good use of the system. One player with a reputation was Shane Watson, but he did manage to get four out of 12 decisions overturned, and his success rate was almost exactly average. In the long run, he did not overuse the system.
When it comes to batsmen subjected to bowling reviews, Cook (24) and Misbah (23) were again the most reviewed batsmen, followed by Younis and Joe Root (20). Younis is notable in that only two out of his 20 bowling reviews were overturned. Similarly, AB de Villiers has faced many unsuccessful bowling reviews, with only two overturns out of 17. The average rate is 21%.
Being given out after a decision is overturned must be a rotten experience: the most for any batsman is five, for Root, Steve Smith, Graeme Smith, Mike Hussey and James Anderson. At the other end of the scale, Dimuth Karunaratne was subjected to 11 bowling reviews but none were overturned.
Shane Watson gained a reputation for overuse of the DRS, but the numbers show he had no less success with his referrals than the average batsman. Joe Root has been given out on review the most: five times
Stu Forster / © Getty Images

Younis could be considered a leading batting beneficiary of DRS. Seven decisions have been overturned in his favour, with only two against - a balance of +5. There is one other batsman with a similar balance: Marlon Samuels has won five out of eight batting reviews, and has never lost out in the eight bowling reviews against him.
Where Broad trumps Anderson
When it comes to bowlers, three names crop up well ahead of the rest. Rangana Herath is on 104 reviews in total (reviews initiated by batsmen and by Herath), James Anderson is on 77 and Graham Swann had 68. Stuart Broad is next on 56.
It should be borne in mind that bowling reviews are usually group decisions involving captains, wicketkeepers and other fielders. It should not always be blamed solely on the bowler if these are unsuccessful.
| Player | Bowling reviews | Success |
| Rangana Herath | 60 | 20% |
| James Anderson | 46 | 20% |
| Trent Boult | 35 | 26% |
| Morne Morkel | 34 | 18% |
| Vernon Philander | 32 | 22% |
| Stuart Broad | 31 | 29% |
| Graeme Swann | 30 | 30% |
| Nathan Lyon | 30 | 10% |
| Tim Southee | 29 | 21% |
| Saeed Ajmal | 27 | 19% |
| Moeen Ali | 27 | 15% |
| Peter Siddle | 23 | 30% |
| Yasir Shah | 22 | 9% |
| Mitchell Johnson | 20 | 15% |
| Kemar Roach | 20 | 25% |
| Dale Steyn | 18 | 39% |
| Zulfiqar Babar | 18 | 28% |
The typical success rate is 20%; anyone with a higher percentage is picking their reviews well. Broad is evidently more selective about his challenges than Anderson. Both have managed nine overturned decisions but Anderson has made 37 failed challenges to Broad's 22.
Anderson leads in an unwanted stat: 20 times he has seen a batsman given out only to have the decision overturned. Herath is next on 14, with Swann on 11. Anderson's nine successful bowling reviews give him a net loss of 11 wickets. He is the only bowler in double figures.
Some notable figures in the table are the low success rate for Nathan Lyon (10%) and the very high success rate for Dale Steyn (39%). Lyon had only one decision overturned out of his first 25 challenges; he has since had two more. Steyn, in addition to being arguably the best bowler of recent times, is also apparently the most clear-eyed, with a success rate much higher than anyone else in the top 20. Not only does he get wickets with a high proportion of his challenges, he also sees 46% of his appeals given out (mostly without being challenged) - the highest success rate among bowlers this century, along with Glenn McGrath.
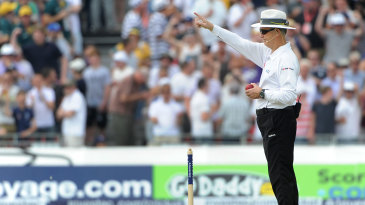
Right on: Asad Rauf's decisions were overturned less than 23% of the time, the lowest among all umpires
Hamish Blair / © Getty Images

Looking at bowlers further down the list, the one with best review success - perhaps ironically - is the sometimes-maligned Watson, who made only eight challenges as a bowler but had five decisions overturned. Less successful is Taijul Islam, with no decisions overturned out of nine challenges to date.
Asad Rauf's big win
It may not be fair to dwell on this subject too much but the data does say something about the number of decisions being overturned from individual umpires. Perhaps the most striking thing about the table is how closely spaced the rankings of the elite-panel umpires are.
A year or two ago, Richard Kettleborough led this table, and he is still one of the top performers. A couple of other current umpires (Chris Gaffaney and Paul Reiffel) are closer to 30%. Asad Rauf attracts fewer reviews per Test (3.95) than the others, possibly a sign of the respect with which his decisions are regarded by the players.
| Umpire | Reviews per Test | % overturned |
| Asad Rauf | 3.95 | 22.8% |
| Richard Kettleborough | 4.82 | 23.0% |
| Nigel Llong | 4.83 | 23.0% |
| Aleem Dar | 5.78 | 23.3% |
| Billy Bowden | 5.80 | 25.0% |
| Ian Gould | 4.29 | 25.0% |
| Marais Erasmus | 4.79 | 25.2% |
| Rod Tucker | 3.9 | 25.2% |
| Steve Davis | 4.43 | 25.5% |
| Kumar Dharmasena | 5.39 | 25.8% |
| S Ravi | 6.53 | 25.8% |
The bottom line
The larger question of whether the DRS enhances the game remains, I suppose, a matter of opinion. A much-quoted rationale for its use is to eliminate howlers that could change the course of a Test. On this it can be judged a success, although by examining thousands of reviews it can be concluded that true howlers are rather rare (and probably have been since the introduction of neutral umpires). Still, it is worth remembering the fury that those old howlers generated, and being glad that they are in the past.
Some may argue that a new class of DRS-specific howler has crept in, but in practice, a great many decisions that are overturned come down to a matter of millimetres, or single frames of video, or barely visible blips on the Snickometer. Some are so close that different reviewers would come to opposite decisions: that's cricket, I suppose.
Some suggested improvements, such as not debiting available reviews when a decision is an "umpire's call", are worth considering in the future.
Personally, I often find the reviews tedious. What would happen if a limit of, say, 90 seconds was placed on the third umpire (in absence of technical faults) to come up with a decision? If it is so close that it takes longer than that, then it should revert to the on-field decision with no loss of challenges. If the on-field umpires, and not players, initiated reviews, we would have to be prepared for virtually every lbw appeal to be reviewed ad nauseam. Actual on-field decisions would become unusual (already the case with run-outs), and the umpire's authority would be diminished.
Charles Davis is a Melbourne-based statistician and author who has developed a large ball-by-ball database for Test matches
© ESPN Sports Media Ltd.