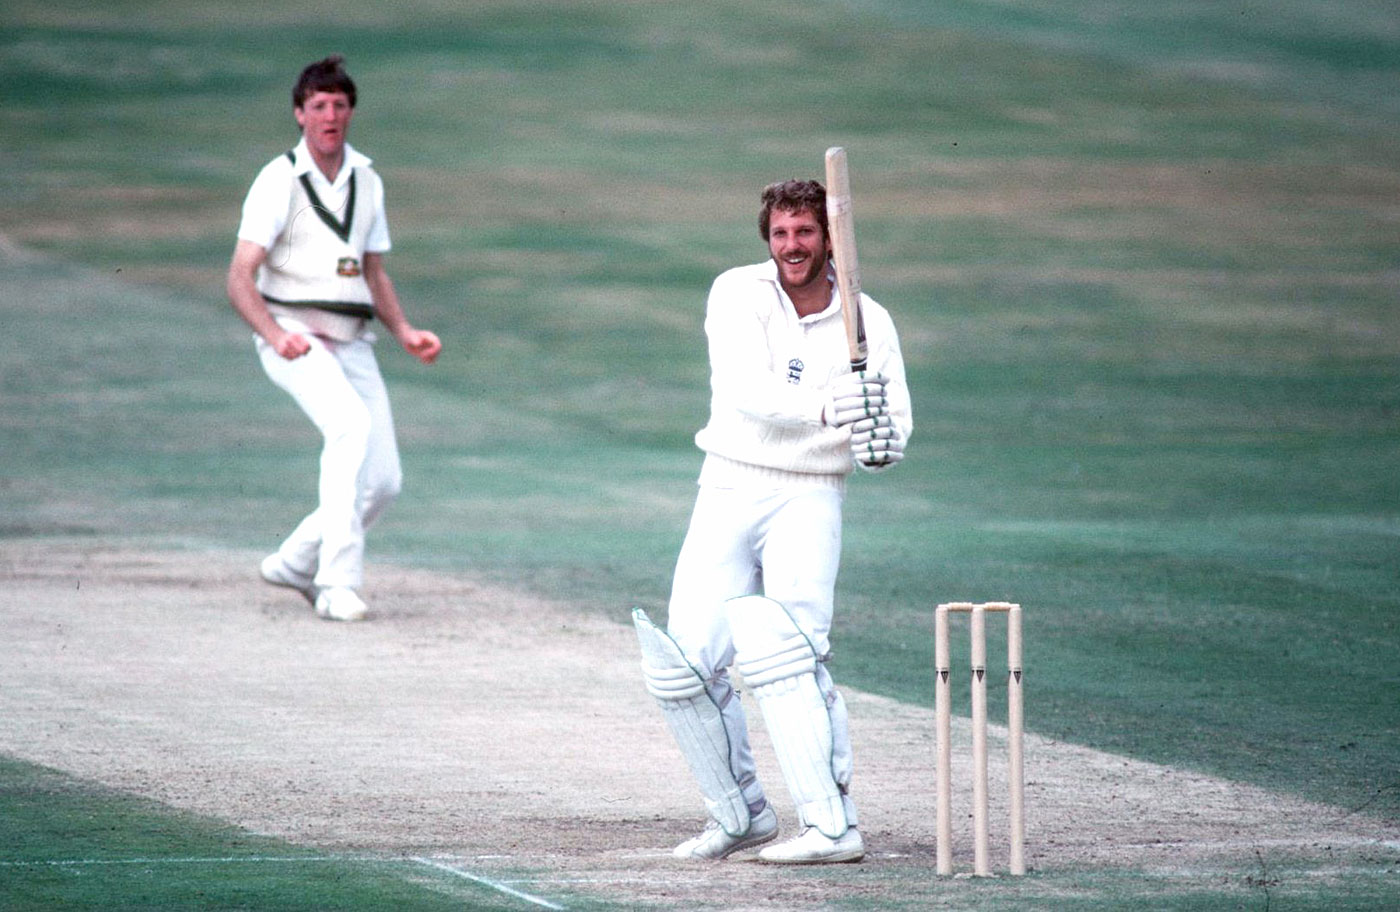
Ian Botham's epic 149 not out at Headingley in 1981 is worth 169% in terms of Real Value


Ian Botham's epic 149 not out at Headingley in 1981 is worth 169% in terms of Real Value
An exhaustive analysis determining the worth of a batter's Test runs has a great allrounder as the biggest gainer
How often have we encountered people saying things like, "The way he anchored the chase, the 96 was worth much more than a hundred", or "There was nothing at stake, he just threw his bat around."
These seemingly objective statements are, in fact, wholly subjective. However, they do convey a message: the value of the runs scored in any given innings could be considerably more or less than the actual figure. For the better part of 2021, I have been working on quantifying this aspect of the game. How do we know the real value of runs? The scorecard already holds a lot of information about a match. What we need is a consistent and sound method to determine this value.
This exercise may remind readers of my Test Performance Analysis for innings and bowling spells. While some of the measures used are common to both analyses, the two are different in nature, and these differences are highlighted later in this article. The bowling aspect will be covered in the next article, a few months hence.
Let me outline the eight parameters that I will be using to determine the Real Value of runs scored.
1. Type of pitch
The tried, tested and accurate Pitch Quality Index measure I devised is used for this. If the PQI values for the first two innings and the third and fourth innings are available separately, these values are used. Otherwise the single match PQI value is used. The values for this factor are in a range of 0.913 to 1.173, with a mean value of 1.003. These values are applicable for the 14,776 individual batting innings of 50 or above in Test history.
2. Opposing team's bowling strength
These are location-specific and career-to-date values. Many bowlers are kings in their own backyards but barely deliver when on the road. Their fortunes move up and down during long careers. The recent form of bowlers is also incorporated. The values for this factor are in a range of 0.900 to 1.167; the mean value is 0.996.
3. Location/Result/Relative Team Strength
This complex composite measure incorporates the Location (home/neutral/away), Result (win/draw/loss) and Relative Team Strength (very weak/weak/comparable/strong/very strong). The combination of these factors provides a powerful and exhaustive 45-strong index value, providing a good handle on the nature of the result. For this factor, the range is 0.900 to 1.097, and the mean value 0.988.The values for the first and second innings are pegged at a lower level than those for the third and fourth innings since the latter are the final innings for the respective teams.
High Scoring Index (HSI) + Innings Peer Value (IPV)
The HSI is a measure of the batting support the player received; players who played lone hands will benefit. The IPV is an indicator of where the player's innings stands in relation to the average of the other 21 innings of the team; those who played standout innings will benefit. For this factor, the values are in the 0.930-1.166 range, and the mean value is 0.996.
5. Strike rate
I thought long and hard about this and decided to use a special and nuanced implementation of the metric - so alien to Test cricket culture - because some innings that transcend the ordinary deserve recognition. There is no balls-faced information for well over half of all matches, but that does not mean batters in those games get penalised in this exercise. I also needed to make sure that top-quality Test innings, such as 112 in 288 balls, are not penalised. The minimum value for this index is 1.00. I cap the maximum strike rate at 200. I adopt a simple formula to reward Test innings with a strike rate in excess of 75. I also adjust the index of innings of above 100 runs slightly upwards if their strike rate is in excess of 75.
That means an innings with an undefined strike rate gets an index value of 1.00, one with a strike rate of 45 gets 1.00, 75 gets 1.00, 87.5 gets 1.01, 100 gets 1.02, 150 gets 1.06, and 200-plus gets the maximum value, 1.10. Viv Richards' blitzkrieg of 110 in 58 balls gets the highest strike-rate index value of 1.104.
Brian Lara's match-winning 153 not out in 1999 against Australia has a Real Value of 214; conversely, his 400 not out against England is worth less than the scored runs, with a Real Value of 378
Ben Radford / © Getty Images

6. Match status
This is determined at the beginning of each team innings and is applied to all individual innings that team innings contains.
First innings: Default value of 1.00. There is nothing to go by. No information is available - on the scorecard - on atmospheric conditions, pitch conditions and level of batting difficulty.
Second innings: Depends on the first-innings score. If facing 500-plus, the index is capped at 1.10. If facing sub-100, it is fixed at 0.90. Anything in between, the index is prorated between 0.90 and 1.10.
Third innings: If the arrears are 200 runs or more, the index is capped at 1.10. If the lead is 200 runs or more, the index is fixed at 0.90. Anything in between, the index is prorated between 0.90 and 1.10.
Fourth innings: Depends on the actual target and the Match-to-date Runs per Wicket. If the target is high relative to the average scores in the match, say a target of 250-plus when the Mtd_RpW is 20, the index will have a high value; when the target is >=12.5 * Mtd_Rpw, the index is capped at 1.10. Conversely, low targets relative to the average runs per wicket will receive a low index value, fixed at the lower level at 0.90 when the target is <=2.5 * Mtd_RpW. For anything in between, the index is prorated between 0.90 and 1.10.
This factor has a range of 0.900 to 1.100 and a mean value of 1.014.
7. Innings status
This is a complex measure. What was the (innings-specific) team target? What was the innings position when the player came in to bat? How far away or close was the target? What was the projected score? Did a wicket fall soon after the player came in? Based on these facts, the innings status is measured. This factor has a range of 0.910 to 1.185 and a mean value of 0.988.
Minor adjustments to match status values (see above) are effected depending on the innings status values. For instance, if the team batting first scores 500, the match status index for the second team will be 1.10, but if a player walks in at a comfortable 200 for 1, that 1.10 is downgraded dynamically. Similarly, in the case of a first-innings total of 95, where a player walks in at 30 for 4 in the second, the index value of 0.90 will be dynamically upgraded.
8. Slack Runs and Margin
To start with, I had applied the seven parameters above and took a look at the results. Two hundreds were in top positions. The lower-placed one was in a tough 29-run win and the higher-placed innings in a comfortable 297-run win. I realised then that there was a need to acknowledge the margin to make sure that the complete match context was incorporated.
With this ninth parameter, I take into account the final margins of wins and rationalise them, bringing in the concept of Slack Runs. This has also allowed me to acknowledge some aspects of hard-fought draws. I may not be able to adequately reward innings where runs scored are low, such as Rachin Ravindra's recent 18 not out off 91 balls in Kanpur, but I am able to recognise important match-saving innings where a decent amount of runs were scored - such as Faf Du Plessis' unbeaten 110 off 376 in Adelaide. This is a highly nuanced parameter. The factor has a range of 0.950 to 1.100 and a mean value of 0.998.
In summary
Innings played on tough pitches will be valued highly; those played in batter-friendly conditions will lose out. Innings against top-quality bowling attacks will benefit; those against run-of-the-mill attacks will not be rewarded. Innings that helped teams win away will benefit. Also, innings against stronger teams. Wins matter - so do heroic efforts to save matches. If a batter receives excellent support, his innings will stand to lose, as against lone-wolf innings. Innings that come in tough match/innings situations will gain a lot. The closer the result is, the greater the value of the innings will be. Finally, quick innings will receive some benefit, though ones that are not will not lose out unduly.
Multiplicative vs additive
There are two ways to achieve the final Real Value Factor. One is to multiply the actual values of each parameter for each innings. For instance: 0.962 * 0.908 * 1.068 * 1.059 * 0.984 * 1.017 *1.00 * 1.014 = 1.002. The other is to add the values (differences from 1.0) to the base index value of 1.0: (1.000 - 0.038 - 0.092 + 0.068 + 0.059 - 0.016 + 0.017 + 0.00 + 0.014 = 1.012), which produces about 1% variation. Both these routes offer similar results and differ by a factor well below 2.5% in most cases.
After studying the summary values for randomly selected individual innings across many dry runs, I decided on the multiplicative route since that way the parameters had stronger and sharper impact on the final valuation. Even if the additive route had been taken, the results would have been quite close to what we have here. When all parameters have narrow, well-defined bands of values, the additive and multiplicative routes often converge.
The calculation process
The eight parameters are determined for each innings. A few of these are at the player-innings level, a few at team-innings level, and a few at match level. Then the Real Value of the innings is determined by multiplying the actual runs scored by the final Real Value Factor. To ensure a proper and balanced implementation of the process, low sub-100 scores are pushed up slightly and high 200+ scores are pulled down slightly. These adjusted values are then compiled at the career level by adding up the Real Values for each innings by a player.
A schematic of the process is given below. Please read clockwise starting from the top.
© Anantha Narayanan

Let me illustrate the process with three innings - the first a recent masterpiece, the second an old classic, the third a big but not extraordinary innings.
Let us take Dhananjaya de Silva's 155 not out in Galle against West Indies. The values of the eight parameters are: PQI=1.071, Bow=1.040, LRT=1.000, H-I=1.040, MSt=1.024, ISt=0.997, SR=1.000 and SlkR=1.051. The Real Value Factor is 1.243. The Real Value of this 155 is 193 (155 * 1.243).
Take Mark Butcher's match-winning 173 not out against Australia in Leeds in 2001. The eight parameters are: PQI=0.984, Bow=1.137, LRT=1.075, H-I=1.036, MSt=1.020, ISt=0.987, SR=1.018, and SlkR=1.010. (Note the credit for the good strike rate of 76.2.) The Real Value Factor is 1.291. The Real Value of the innings is 223. Almost all the factors are positive.
Now for Hashim Amla's good-but-not-great innings of 208, in a Test that South Africa won against West Indies in Centurion in 2014. The eight parameters are: PQI=0.993, Bow=0.908, LRT=1.005, H-I=1.003, MSt=1.000, ISt=0.967, SR=1.000 and SlkR=0.974. The Real Value Factor is 0.855. The Real Value of 208 is 178.
Real Value vs Performance Analysis
Readers might be aware that I have in the past written articles on exhaustive innings/spell performance analyses. The top innings compiled by the innings-related work are called the Golden Willow 25 (GW 25). At surface level that might look similar to this Real Value list because variations of the same parameters are used in both, but they are quite different. These are explained below.
The objective of the Performance Analysis exercise was to determine the best innings played. There was no intention to extend this to the player's career as a whole. The objective of Real Value Analysis is to determine the real value of career runs. The emphasis is on the career. The innings valuation is only an important base step.
In Performance Analysis, the runs scored are just one parameter. Thus, it is possible for the magnificent MCG 100 not out by Kim Hughes to score more GW 25 rating points than a 400 not out by Brian Lara. In Real Value processing, the runs scored is the key base value. A score of 100 will never be valued at 300, nor even at 200. A 300 will never be valued at 120. This sort of valuation is not the objective. The 400 continues to hold sway as the innings with the highest notional value - 378, though it loses some value in comparison to the actual score. But a magnificent match-winning innings by Lara himself - the 153 not out - is valued at 214 runs, thus reducing the gap in value between the two innings.
There is a good correlation between the two processes as far as the very top innings are concerned. A Kusal Perera 153 not out or an Ian Botham 149 not out are valued very highly in both analyses.
In the Performance Analysis, my methodology was geared to make sure that the top 15,000 or so innings would be rated correctly. There was no guarantee that an innings of 25 would be rated properly. It is very difficult to even assign a value to such an innings. In Real Value analysis every innings has to be valued properly.
The graphs and tables below are of two types. The first ones are the tables of top innings. These are the basis on which the career values are developed. The second lot is the more relevant one of career runs. I will make sure that almost all important innings and players are covered. The article is current to the end of the recent Ashes. In all the graphs grey indicates the actual runs scored and red the Real Value of the runs.
Innings charts
First let us look at the innings worth 100 or more that were valued very highly.
© Anantha Narayanan

When I started this exercise, I expected that the famous innings by Botham, Perera and Azhar Mahmood would be competing for the top spot. My intuition proved right. These three are in the top five.
Can there even be an iota of doubt about Botham's innings: follow-on, seven wickets down, innings still in arrears, and a narrow win. The 149 is up 69% on the actual score to 252 in Real Value. Perera's innings: an away win, by just one wicket, a terrific bowling attack, disastrous match/innings situations, no great support. The Real Value of his innings is 253, a 65% increase.
Gilbert Jessop's 104, after he came in at 48 for 5, which took England to a pulsating one-wicket win, got a 65% lift. For want of balls-played information, the strike-rate parameter for this innings is pegged at 1.00. In reality, since it was a 77-minute innings, he might have played around 75-80 balls. If that were taken into consideration, his innings would be elevated still further and might take top spot, but I did not want to make off-the-cuff adjustments like this.
Next is Dinesh Chandimal's third-innings, an unbeaten 162 against India - made after he came in at 92 for 4 with his team still in arrears by 100 runs - which has a Real Value score of 250. Azhar Mahmood's first-innings effort of 132, which he made after coming in at 89 for 5, resulted in a close away win.
These are five once-in-a-lifetime innings and have been duly rewarded. For innings to enjoy substantial uplifts, it is essential that the value for almost all parameters has to be above 1.0. All parameters for the two top innings are above 1.00, and Jessop's would likely have been, as explained above. Among the top 25 innings in this table, there are only ten that are also on the GW 25 table. This confirms that the two analyses are fundamentally different.
Let us briefly look at hundreds that were worth far less in Real Value terms than their actual score.
Aravinda de Silva's 126 made in that batathon in Colombo in 1997 loses the most, and has a Real Value of 88 runs; he walked in at 615 for 2. Neil Harvey's 100, played in a dull draw in Johannesburg in 1950, comes in second, with a Real Value of a mere 70. In third place is Kumar Sangakkara's hundred in his second outing of the high-scoring Test in Chittagong in 2014 (he scored a triple-hundred the first time round.)
Among fifties, Wallis Mathias' patient 64, coming in at 22 for 4 in a low-scoring match in Dacca in 1959, for which the PQI was 20.5, won the game for Pakistan. It gets an increase of 80% on the actual score in Real Value terms. Graham Dilley's 56 at Headingley in 1981, when he batted alongside Botham, is the next highest-valued fifty. Len Hutton's all-time classic - the 62 in Brisbane in 1950, is next, followed by Jermaine Blackwood's 55 in a one-wicket win against Pakistan last year, and Graham Thorpe's magnificent 62 against a quality Australian attack in a 19-run win at The Oval in 1997. All these innings get a boost of over 70% in Real Value terms as compared to the actual scores.
Moving on to the next chart: significant innings that have not featured above. These are listed in the order of the percentage of runs gained. In this table and the next, the symbol @ indicates that the Balls Played value for that row is estimated.
© Anantha Narayanan

Ben Stokes' match-winning masterpiece, the 135 not out against Australia, moved up to 195 in Real Value. Saeed Anwar's magnum opus, where he carried his bat for 188 in Calcutta in 1999, helped Pakistan recover from 26 for 6 on the opening morning and go on to win the Test. Adam Gilchrist's match-winner, in only his second Test, gained over 60 runs over the actual score in Real Value. Then comes Graham Gooch's 154 against West Indies in 1990, valued at 218 runs, followed by Lara's 153 not out.
Don Bradman's Bodyline hundred is the highest featured innings from the master. VVS Laxman's 281 gained only around 25% in Real Value, and the reason is that the pitch had eased out and India's final margin of victory was huge. Charles Bannerman's 165 in the first-ever Test match rose to 206.
© Anantha Narayanan

In draws, Alan Knott's 73, in Georgetown in 1968, to save England from a disastrous 41 for 5 in the last innings stands out. du Plessis' Adelaide marathon was played in his debut Test. Ken Mackay's priceless innings came in that famous series against West Indies. An effort of more recent vintage is Usman Khawaja's match-saving effort in Dubai in 2018.
Sunil Gavaskar's 221 almost took India to a famous win at The Oval. Hanif Mohammad's 16-hour epic is the longest innings ever played, and it saved Pakistan from a huge defeat. Dennis Amiss' vigil in Kingston lasted almost ten hours and Mike Atherton's epic in Johannesburg even longer.
Sanath Jayasuriya's 340, in a team total of 952, is featured just to show that the big innings do lose some - and in certain cases a lot - of value.
Among innings in losing matches, we have Nathan Astle's counterattacking 222 and Lara's first-innings classic of 226 in Australia. Sachin Tendulkar's brave 136 in Chennai, though in a loss, gets a lift of over 13%.
Career charts
When it comes to career runs, and let us start with the most important chart: players with 5000 or more runs who have had the highest value enhancement.
© Anantha Narayanan

When I started this exercise, I was convinced that a batter who played over 100 Tests would not be in the top ten. In a long career, he would have made cheap runs, flat-track runs and help-yourself runs. These would even out across a long career. I expected that most of the batters who have made 8000-plus runs would be in the 98% to 102% bracket.
As anticipated, the middle-to-high run-makers dominate this table. Botham is on top. Many of his runs - like the 149 - came in difficult situations. He got an extraordinary 10% uplift to his career runs. Graham Thorpe and Angelo Mathews come in next, but with a steep drop in the percentage gained, 6.6 for both. This shows how tough it is to get significant improvements.
It is interesting to note that half the names on this table are English batters, all of whom have played in recent decades. This could be due to the fact that pitches in England, for the most part, have supported bowlers, which means runs scored in England acquire additional value. The frequency of series against strong Australian or West Indian teams could also have played a part.
Gundappa Viswanath's presence in the middle of the table should please his many fans. The players with high aggregates are in the second half of this table. Joe Root's career aggregate is 4% higher in Real Value terms than his actual aggregate. A great many of his runs have been scored in trying circumstances, as have Lara's and Laxman's.
At the other end of the spectrum are those whose career aggregates have devalued the most. The reduced values are shown in a lighter shade of red.
© Anantha Narayanan

These players have all lost between approximately 7% and 3% of their career runs. In the cases of Wally Hammond, Len Hutton and Jack Hobbs, it is a question of their losing out in some of their bigger innings and the absence of real impact innings to compensate. The presence of three Australian batters of the 1990s on this table is intriguing, and may have something to do with the bowling attacks they faced.
Now to batters who have over 1000 but fewer than 5000 career runs.
© Anantha Narayanan

Kusal Perera has scored only just over 1100 runs but included in these is his 153 not out, which is the all-time best innings in my GW 25 table. He gained nearly 140 runs in that single match. Overall he has had a remarkable push-up of around 20%. The much maligned Mark Ramprakash played some gritty innings and these helped move his career runs up by almost 15%.
No one should be surprised that Rishabh Pant features here. Many of his recent innings have been truly valuable, and his aggregate moves up by 14%. Peter Willey might not have scored many runs, but those he scored were extremely valuable. Jermaine Blackwood, who has played some fine innings for West Indies recently, sees an increase of 12%. Tony Greig is the only player featured here to have scored over 3000 Test runs.
Finally, the top batters who have not featured in these tables until now.
© Anantha Narayanan

Viv Richards scored well against India (away), England and Australia. Steve Smith and Kane Williamson have been very effective in dicey situations and away series; Virat Kohli's upwards valuation is almost identical to Smith's, about 2%. Virender Sehwag's aggregate runs total is almost identical to the Real Value of those runs.
Most of the other batters featured - the likes of Tendulkar, Gavaskar and Ricky Ponting - have had long careers, and as I have explained earlier, there are bound to be some lower-value runs in their kitty. Still, no one from this list has gone below 97.7%.
Now for a special analysis. I consider rolling ten-Test segments for all qualifying players and look at the Real Value of runs scored by the player in those Tests vis a vis his actual aggregate in them. I ensure that this slice of the player's career is relevant by considering only ten-Test phases in which over 500 runs were scored. The list below is in order of the percentage-change in value.
© Anantha Narayanan

Can anyone ever forget the Botham of 1981? He scored 520 runs in that phase and achieved a stupendous increase of 136.6%. There is another Botham slice, which came in at 148%, but it did not meet the 500-run criterion. Asad Shafiq's purple run in the UAE in 2012 and 2013 is in second place. Laxman's ten-Test slice, in which he achieved 122%, lasted over two years and included the Sydney classic in 2000 and the Kolkata double a year later.
Lara's purple slice included his Bridgetown masterpiece; Viswanath's included his famous 97 not out against West Indies. Jos Buttler's 2018-19 exploits are featured here, as are Dimuth Karunaratne's recent performances. Some of these players, by virtue of their long careers, are likely to have many such successful career slices.
Overall statistics
In the 2446 Tests until now, 86,846 innings have been played. A total of 2,283,174 runs have been scored. The Real Value of these runs is 2,253,771. This indicates a valuation of 98.7%.
Considering only innings of 50 runs or more, 14,776 innings have been played and a total of 1,305,405 runs scored. The Real Value of these runs is 1,305,827. That is a valuation of 100.03%. This indicates that in significant innings the increases and drops in values match almost totally.
Conclusion
It can be seen that a significant upgrading (of the order of +5%) of career runs in terms of Real Value happens for those batters who have played around 80-100 Tests and bat in the middle- or late-middle order.
Top-order batters and those with long careers tend to have their career runs evened up between 98% and 102%. Root and Lara are the exceptions, with 4% lifts. Neither had great success as a leader but both were way above their team-mates when it came to batting.
Email me at ananth.cricinfo.comments@gmail.com with your comments and I will respond. This email id is to be used only for sending in comments. Please note that readers whose emails are derogatory to the author or any player will have their ids permanently blocked.
Anantha Narayanan has written for ESPNcricinfo and CastrolCricket and worked with a number of companies on their cricket performance ratings-related systems
© ESPN Sports Media Ltd.


